A coffee refractometer tells you in seconds whether your espresso or filter coffee is actually extracted correctly, not whether it tastes like it might be. Without one, you are adjusting grind size and dose by taste alone, which means you are always one variable behind the problem.
Total dissolved solids (TDS) and extraction yield are the two numbers every serious home barista needs to dial in consistently. A refractometer measures both from a single drop of brewed coffee, giving you the data to fix under-extraction (sour, thin, weak) and over-extraction (bitter, dry, astringent) before you waste another bag of beans.
| Photo | Popular Coffee Makers | Price |
|---|---|---|
|
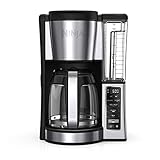
Ninja Fresh Brew Coffee Maker, 12 Cup Glass Carafe, Stainless Steel, CE251 | Check Price On Amazon |

|
Hamilton Beach 2-Way Programmable Coffee Maker & Single Serve Coffee Maker | Check Price On Amazon |

|
Keurig K-Elite Single Serve K-Cup Pod Coffee Maker, with Strength and Temperature Control, Iced Coffee Capability, 8 to 12oz Brew Size, Programmable, Brushed Slate | Check Price On Amazon |

|
KRUPS Simply Brew Compact 5 Cup Coffee Maker: Stainless Steel Design, Pause & Brew, Keep Warm, Reusable Filter, Drip-Free Carafe | Check Price On Amazon |

|
Ninja Luxe Café Premier 3-in-1 Espresso Machine, Drip Coffee, & Cold Brew | Check Price On Amazon |
This guide covers how a coffee refractometer works, how to use one correctly, which models are worth buying, how to interpret your readings, and how to use the data to improve every brew method you use, including espresso, pour over, French press, AeroPress, and cold brew.
What Is a Coffee Refractometer and How Does It Work?
A coffee refractometer measures the concentration of dissolved coffee compounds in brewed liquid by detecting how much a light beam bends as it passes through the sample. This measurement is called the refractive index, and it directly correlates to TDS (total dissolved solids), expressed as a percentage of the total liquid weight.
The physics behind it are straightforward. Light travels at a different speed through a solution than through pure water. The denser the solution (more dissolved coffee solids), the more the light bends. The refractometer converts this bending angle into a Brix reading, which coffee-specific refractometers then translate into a TDS percentage using the coffee refractive index correction.
From TDS and your brew ratio, you can calculate extraction yield using the formula developed by the Specialty Coffee Association (SCA). Extraction yield equals TDS multiplied by the water weight, divided by the coffee dose weight. The SCA defines the ideal extraction yield range as 18% to 22% for both espresso and filter coffee, with optimal TDS ranging from 1.15% to 1.45% for filter coffee and 8% to 12% for espresso.
In plain terms: the refractometer tells you exactly how much of your coffee dissolved into the water, and whether that amount falls inside the flavor sweet spot.
Two main types of refractometers are used for coffee. Optical refractometers require no batteries and use an eyepiece to read a scale manually. Digital refractometers use a sensor and display a numerical reading directly, removing the subjectivity of eyepiece alignment. For coffee work, digital models calibrated with a coffee-specific refractive index correction are the standard choice because they are faster, more repeatable, and compatible with the VST Coffee Tools app and similar software.
The VST refractometer, developed by Vince Fedele of VST Inc. and launched commercially around 2008, became the industry standard for specialty coffee TDS measurement. The VST Coffeetools app calculates extraction yield automatically from TDS and brew ratio inputs, making manual formula calculation unnecessary for most users.
For most home baristas, a refractometer is the single tool that turns subjective taste adjustments into objective, repeatable dialing-in decisions.
Why Does TDS and Extraction Yield Actually Matter for Flavor?
TDS and extraction yield are not abstract lab metrics. They map directly to the specific flavor failures you taste in the cup. Under-extracted coffee (below 18% extraction yield) tastes sour, salty, and underdeveloped because the first compounds to dissolve are acids and salts, not the sugars and complex aromatics that create balance and sweetness.
Over-extracted coffee (above 22% extraction yield) tastes bitter, dry, and astringent because the later-extracting compounds, including harsh tannins and degraded chlorogenic acids, dominate the flavor. The 18% to 22% extraction yield window is where sugars, acids, and aromatics are in proportion, producing a balanced, sweet, clean cup.
This happens because coffee solubles dissolve in a predictable order. Acids and salts dissolve first at any temperature. Sugars and caramelized compounds dissolve next. Bitter phenolic compounds dissolve last, and they are the ones you want to stop before they dominate. The extraction yield percentage tells you exactly where in this sequence your brew stopped.
This only works as a diagnostic tool when you know both your TDS and your brew ratio. TDS alone is not enough. A 1.4% TDS reading from a 1:15 brew ratio (15g coffee to 225g water) represents a different extraction yield than the same 1.4% TDS from a 1:17 brew ratio. The extraction yield formula accounts for the ratio difference and gives you a comparable number regardless of brew method.
According to Scott Rao’s “The Professional Barista’s Handbook” (2008), TDS and extraction yield together define coffee strength and quality more precisely than any sensory evaluation alone, particularly when diagnosing systemic problems with grind consistency or dose calibration.
If your extraction yield is below 18%, the fix is almost always one of three things: grind finer, raise water temperature, or slow the brew. If it is above 22%, grind coarser, lower water temperature, or shorten contact time. The refractometer tells you which direction to move before you taste a single drop.
For espresso specifically, extraction yield below 18% with a 1:2 brew ratio (18g dose to 36g yield) produces a shot that tastes sour and sharp regardless of the bean quality. Extraction yield above 22% produces bitterness that no milk or sugar fully masks. The target window is narrow, and the refractometer is the only tool that tells you exactly where you landed.
How to Use a Coffee Refractometer: Step-by-Step Guide
Using a coffee refractometer correctly requires consistent sample preparation. Inconsistent temperature, contaminated samples, or improper zeroing produces readings that vary by 0.1% to 0.3% TDS, which translates to a 1% to 2% swing in calculated extraction yield, enough to send you in the wrong direction when dialing in.
Follow these steps every time for reliable, repeatable results.
Step 1: Cool the sample to room temperature (approximately 20°C to 25°C / 68°F to 77°F). Hot liquid gives an inaccurate reading because thermal expansion changes the refractive index independently of TDS. Use a metal spoon on a cold surface or a small sample cup in a cool water bath to bring the sample down within 2 to 3 minutes.
Step 2: Zero the refractometer with distilled or reverse-osmosis water at the same temperature as your sample. Place one or two drops of distilled water on the sensor, wait for temperature stabilization (usually 20 to 30 seconds), and press the zero button. This step is mandatory every session. Tap water contains dissolved minerals that shift the zero point and produce consistently false-high TDS readings.
Step 3: Apply one to two drops of the cooled coffee sample to the sensor. For espresso, dilute the sample first. A standard dilution is 1 part espresso to 3 parts distilled water (1:3 dilution). Measure the diluted sample, then multiply the TDS result by 4 to get the actual espresso TDS. Undiluted espresso can exceed the measurement range of most refractometers and damage the sensor lens with concentrated coffee oils.
Step 4: Wait for temperature stabilization and take the reading. Most digital refractometers display a stable reading within 20 to 45 seconds. Avoid breathing on the sensor during this period. Record the Brix reading and the temperature.
Step 5: Apply the coffee refractive index correction. Raw Brix is calibrated for sucrose solutions, not coffee. Most coffee-specific refractometers (VST, Atago PAL-COFFEE) apply this correction automatically. If using a general Brix refractometer, multiply the Brix reading by 0.85 to approximate coffee TDS. This correction factor is derived from VST’s calibration research.
Step 6: Calculate extraction yield. Use the formula: Extraction Yield (%) equals TDS (%) multiplied by beverage weight (g), divided by dry coffee dose (g). For a pour over with a 1.35% TDS, 250g of beverage, and a 15g dose: 1.35 times 250, divided by 15, equals 22.5% extraction yield. That reading is at the upper boundary of the SCA ideal range and suggests slightly reducing extraction by coarsening the grind or shortening steep time.
Step 7: Clean the sensor immediately after measurement. Wipe with a damp lint-free cloth, then dry completely. Coffee oils left on the sensor shift subsequent readings. For optical refractometers, avoid pressing hard on the prism surface to prevent scratching.
For the most consistent results at home, take three readings from the same sample and average them. Sample-to-sample variation in a well-made shot should be under 0.05% TDS. Variation above 0.1% TDS suggests either inconsistent sample temperature or a sensor that needs recalibration.
A digital coffee refractometer with automatic temperature compensation (ATC) simplifies this process significantly by adjusting the reading for temperature variation automatically, removing step 1 as a critical variable for filter coffee samples (though cooling espresso samples before dilution is still recommended).
Which Coffee Refractometers Are Worth Buying?
Four refractometer models cover the full range of home barista and professional needs, from a $50 entry-level optical unit to a $330 industry-standard digital instrument. The right choice depends on how frequently you measure and how much measurement consistency matters to your workflow.
Use the table below to compare the four main options across the specifications that matter most for coffee use.
| Model | Type | TDS Range | Resolution | Coffee Correction | ATC | Price (USD) | Best For |
|---|---|---|---|---|---|---|---|
| VST LAB III | Digital | 0-25% Brix | 0.001% TDS | Yes (built-in) | Yes | $300-330 | Professional, competition, cafe calibration |
| Atago PAL-COFFEE (BX/TDS) | Digital | 0-22% Brix / 0-16% TDS | 0.01% TDS | Yes (built-in) | Yes | $130-160 | Serious home baristas, daily dialing-in |
| Atago PAL-1 (Brix only) | Digital | 0-53% Brix | 0.1% Brix | No (manual x0.85) | Yes | $90-120 | Budget digital option, filter coffee work |
| Pocket Optical Refractometer (0-10 Brix) | Optical | 0-10% Brix | 0.2% Brix | No | Yes (basic) | $30-60 | Beginners, occasional use, filter coffee only |
| DiFluid R2 Extract | Digital | 0-25% Brix | 0.003% TDS | Yes (built-in) | Yes | $70-90 | Value pick for espresso and filter work |
VST LAB III: The Professional Standard
The VST LAB III is the instrument that established coffee refractometry as a professional practice and remains the reference standard used by World Barista Championship competitors and specialty coffee labs worldwide. Its 0.001% TDS resolution is ten times finer than the Atago PAL-COFFEE, which matters when comparing shots that differ by 0.02% to 0.05% TDS during espresso recipe development.
Key Specifications: Resolution: 0.001% TDS. Range: 0-25% Brix. Temperature compensation: automatic (ATC). Coffee refractive index correction: built-in. Connectivity: USB and Bluetooth for VST CoffeeTools app. Price: $300 to $330.
The VST LAB III is the right choice for espresso competition preparation, cafe recipe calibration, or any workflow where shot-to-shot consistency data is logged over time. For most home baristas who brew once or twice daily, the VST’s resolution advantage over the Atago PAL-COFFEE is not practically meaningful.
Atago PAL-COFFEE: The Best Value for Serious Home Use
The Atago PAL-COFFEE BX/TDS refractometer is the most practical choice for home baristas who measure daily and want a dedicated coffee instrument without the VST’s professional price. It displays both Brix and TDS simultaneously with the coffee refractive index correction applied automatically, and its 0.01% TDS resolution is sufficient for all practical espresso and filter dialing-in work.
Key Specifications: Resolution: 0.01% TDS. Measurement range: 0-16% TDS / 0-22% Brix. ATC range: 10°C to 100°C. Sample volume: 0.3ml. IP65 waterproof rating. Price: $130 to $160.
The PAL-COFFEE is small enough to keep next to the espresso machine, measures from a 0.3ml sample, and requires no manual correction factor. For most home espresso setups, it is the best combination of accuracy and usability at a price that is justified by the cost of beans it helps you stop wasting.
DiFluid R2 Extract: The High-Value New Entry
The DiFluid R2 Extract entered the market as a serious competitor to the Atago PAL-COFFEE at roughly half the price. Its 0.003% TDS resolution sits between the Atago and the VST, and it connects via Bluetooth to the DiFluid app for extraction yield calculation. Independent testing by multiple specialty coffee communities including Home-Barista.com confirmed readings within 0.02% TDS of the VST LAB III across filter coffee and espresso samples.
Key Specifications: Resolution: 0.003% TDS. Range: 0-25% Brix. ATC: Yes. Bluetooth app connectivity: Yes (iOS and Android). Sample volume: 0.3ml. Price: $70 to $90.
For home baristas who want near-professional accuracy and app-based extraction yield logging at a budget price, the DiFluid R2 Extract is currently the most compelling value in coffee refractometry.
Optical Refractometers: Useful with Limitations
A pocket optical refractometer in the 0 to 10 Brix range costs $30 to $60 and requires no batteries. It measures filter coffee TDS adequately (filter coffee sits between 1% and 2% TDS, well within the 0 to 10 Brix range). The limitations are significant for espresso work: espresso TDS ranges from 8% to 12%, which requires dilution before measurement, and the 0.2% Brix resolution means you can only detect TDS changes of approximately 0.17%, which is too coarse for precise espresso extraction yield calculation.
An optical refractometer is a reasonable starting point for filter coffee work where a 0.2% Brix resolution is acceptable, but it cannot replace a dedicated digital instrument for espresso dialing-in. For most home baristas who start with an optical unit and develop a consistent practice, upgrading to the Atago PAL-COFFEE or DiFluid R2 Extract within six months is the common progression.
For the most consistent readings across all brew methods, a dedicated digital refractometer with an automatic coffee refractive index correction is the right long-term investment.
Here is a step-by-step guide widget showing exactly how to take a refractometer reading, covering the critical sample preparation steps that most tutorials skip.
Step-by-Step Guide
How to Take a Coffee Refractometer Reading
7 steps · Total time approx. 5 minutes per reading
Cool your sample to 20-25°C (68-77°F)
Use a metal spoon on a cold surface or a sample cup in cool water. Hot liquid gives false-low readings due to thermal expansion of the liquid.
Zero the refractometer with distilled water
Place 1 to 2 drops of distilled or RO water on the sensor, wait 20 to 30 seconds, and press zero. Tap water contains dissolved minerals that produce false-high TDS readings.
Dilute espresso samples before measuring (1:3 dilution)
Mix 1 part espresso with 3 parts distilled water. Measure the diluted sample, then multiply the TDS reading by 4. Undiluted espresso exceeds the range of most refractometers.
Apply 1 to 2 drops of cooled sample to the sensor
Do not breathe on the sensor during measurement. Breath humidity shifts the reading by up to 0.05% TDS on humid days.
Wait for temperature stabilization and record the reading
Most digital refractometers stabilize in 20 to 45 seconds. Note the TDS percentage and the measured temperature for your records.
Calculate extraction yield from TDS and brew ratio
Formula: Extraction Yield (%) = TDS (%) x Beverage Weight (g) / Dose (g). Or use the VST CoffeeTools app or DiFluid app to calculate automatically from your inputs.
Clean the sensor immediately with a damp lint-free cloth
Coffee oils left on the sensor shift all subsequent readings. Dry completely before storage. Never use abrasive cloths on the prism or sensor lens.
How to Read Refractometer Results and Adjust Your Brew
A refractometer reading only has value if you know what to do with the number. The SCA Brewing Control Chart maps TDS against extraction yield to define four flavor zones: ideal (balanced), over-extracted (bitter), under-extracted (sour), and too strong or too weak regardless of extraction quality. Understanding which zone your brew falls into tells you exactly which variable to change.
The four flavor zones work like this. Under-extracted and weak (extraction yield below 18%, TDS below 1.15%): brew tastes sour, sharp, hollow, and thin. The fix is to increase extraction by grinding finer, raising water temperature, increasing brew time, or increasing dose. Under-extracted but strong (extraction yield below 18%, TDS above 1.45%): brew tastes sharp and concentrated simultaneously, common in espresso with too-fine a grind causing channeling. The fix is to address channeling through better puck preparation or coarsen the grind and increase dose weight.
Over-extracted and weak (extraction yield above 22%, TDS below 1.15%): brew tastes bitter but thin, common in drip machines with too-fine a grind and too little coffee. Coarsen the grind and increase dose. Over-extracted and strong (extraction yield above 22%, TDS above 1.45%): brew tastes bitter and heavy, most common in moka pot or French press with over-steep. Coarsen the grind and reduce steep time or dose.
This happens because TDS measures how much dissolved in the water, while extraction yield measures what percentage of the original coffee grounds dissolved. A brew can have high TDS (strong) but low extraction yield (only acids dissolved, not sugars) if the dose was very high but contact time was short. Both numbers together paint the full picture.
Use the table below to match your refractometer reading to the correct flavor diagnosis and adjustment for each brew method.
| Brew Method | Ideal TDS (%) | Ideal Extraction Yield (%) | Brew Ratio (dose:water g) | Water Temp °F (°C) | If Under-Extracted: Fix | If Over-Extracted: Fix |
|---|---|---|---|---|---|---|
| Espresso | 8-12% | 18-22% | 1:2 (18g:36g) | 197-203°F (92-95°C) | Grind finer; check for channeling | Grind coarser; reduce yield |
| Pour Over / V60 | 1.15-1.45% | 18-22% | 1:16.67 (15g:250g) | 200-205°F (93-96°C) | Grind finer; slow pour | Grind coarser; faster pour |
| French Press | 1.15-1.35% | 18-22% | 1:15 (30g:450g) | 200°F (93°C) | Grind finer; add 30 sec steep | Grind coarser; reduce steep time |
| AeroPress | 1.2-1.5% | 18-22% | 1:12-1:16 (15g:180-240g) | 185-205°F (85-96°C) | Grind finer; raise temp | Grind coarser; reduce steep |
| Drip Coffee Machine | 1.15-1.35% | 18-22% | 1:15-1:17 (60g:900g) | 195-205°F (90-96°C) | Grind finer; increase dose | Grind coarser; reduce dose |
| Cold Brew Concentrate | 3-5% (before dilution) | 18-22% | 1:8 (100g:800g) | Cold (35-40°F / 2-4°C) | Extend steep by 4 hours | Reduce steep time; coarsen grind |
For espresso specifically, a reading of 9.5% TDS from a 1:2 brew ratio (18g dose, 36g yield) calculates to approximately 19% extraction yield, sitting squarely in the SCA ideal range. If the shot tastes balanced and sweet, these numbers confirm your recipe is dialed in and repeatable. If TDS reads 7.2% from the same ratio, extraction yield drops to roughly 14.4%, which explains a sour, underdeveloped shot even if the timing looked correct.
For filter methods, the SCA Golden Cup Standard defines the ideal TDS range as 1.15% to 1.35% for drip and pour over. According to the SCA Brewing Handbook, most consumers in North American preference studies rated coffees in the 1.2% to 1.3% TDS range as ideal, with preferences shifting slightly lower (1.1% to 1.25%) in Scandinavian markets where lighter, more transparent cup profiles are preferred.
The refractometer reading is only as good as the sample it measures, and consistency in sample preparation is the only way to make the numbers actionable across different brewing sessions.
Using a Refractometer to Dial In Espresso: A Practical Workflow
Dialing in espresso with a refractometer is a systematic process that replaces the traditional “pull a shot, taste, adjust, repeat” method with a data-driven sequence. The goal is to reach a 1:2 brew ratio (18g dose to 36g yield) with a 25 to 30 second extraction time, a TDS of 9% to 11%, and an extraction yield of 19% to 21%, in the fewest possible iterations.
The correct sequence is: set the dose first, then adjust grind size to control shot time, then adjust yield to fine-tune strength and extraction yield. Changing grind and dose simultaneously makes the refractometer data uninterpretable because two variables changed between readings.
Start with a standard recipe. Use 18g of freshly ground coffee, target 36g yield, and aim for a 28-second extraction time from first drip. Pull the shot, collect a sample, cool it to room temperature, take the refractometer reading, and calculate extraction yield.
This only works when the grind is consistent. A blade grinder produces particles ranging from 100 to 1000 microns in the same batch, meaning TDS readings vary by 0.3% to 0.8% between shots pulled identically because extraction rate fluctuates with particle size distribution. A burr grinder with 40mm or larger flat or conical burrs produces a particle distribution tight enough for refractometer data to be meaningful. A flat burr grinder for espresso in the $150 to $300 range is the minimum equipment requirement for refractometer-guided dialing-in to produce actionable results.
If extraction yield is below 18%: grind 1 step finer on a stepped grinder, or rotate the stepless adjustment collar by 5 to 10 degrees finer. Pull another shot at the same dose and yield target. Re-measure. One grind step typically shifts extraction yield by 0.5% to 1.5% depending on the grinder and bean. Repeat until extraction yield reaches 19% to 21%.
If extraction yield is above 22%: grind 1 step coarser. If the shot time dropped below 20 seconds at the correct yield, check for channeling by pulling a naked (bottomless) portafilter shot and observing the extraction pattern. Channeling causes false-high TDS readings in localized over-extracted channels while other areas under-extract, producing a mixed flavor profile that the refractometer cannot fully capture.
Once extraction yield is in range, adjust yield weight to fine-tune strength. Dropping yield from 36g to 32g (1:1.78 ratio) increases TDS without changing extraction yield proportionally because you are collecting less of the later-extracting, lower-concentration liquid. Increasing yield from 36g to 40g (1:2.22 ratio) lowers TDS and pulls more of the dilute later extraction into the cup.
According to World Barista Champion James Hoffmann’s research and writing on espresso parameters, the most common home barista mistake when using refractometer data is adjusting multiple variables between shots, making it impossible to attribute the change in extraction yield to any single adjustment. Change one variable per shot and record both the recipe change and the resulting TDS reading every time.
A precision espresso scale with 0.1g resolution and a built-in timer is essential for this workflow. A 1g variation in yield changes TDS by approximately 0.2% and extraction yield by approximately 0.5%, enough to shift interpretation from ideal to under-extracted if not measured precisely.
Most home baristas who adopt a refractometer-guided dialing-in workflow report reaching their target extraction yield in 3 to 5 shots per new bag of beans, compared to 8 to 15 shots using taste-only adjustments. The time saved in wasted coffee over a year of daily espresso quickly exceeds the cost of the instrument.
Using a Refractometer for Filter Coffee, Cold Brew, and Other Brew Methods
A refractometer is not just for espresso. Filter coffee, pour over, French press, AeroPress, and cold brew all benefit from TDS measurement, and the SCA’s Brewing Control Chart applies equally to all of them. The key difference from espresso is that filter coffee TDS sits between 1.0% and 1.6%, which is within the direct measurement range of most refractometers without dilution.
Pour Over and V60: Dialing In with the Refractometer
Pour over extraction yield is controlled primarily by grind size and pour technique. A 1:16.67 brew ratio (15g coffee, 250g water, 200°F / 93°C water) targeting 1.25% to 1.35% TDS and 20% to 22% extraction yield is the SCA Golden Cup Standard baseline for most medium roast pour over work.
Take a refractometer reading from a sample collected from the center of the carafe after the brew is complete and mixed. The final 20% of the pour extracts at a different rate than the first 80%, so sampling from the stream during brewing gives a misleading mid-brew reading. Mix the full carafe before sampling.
If extraction yield reads below 18% on a V60 or Hario pour over with a 1:16.67 ratio at 200°F (93°C): grind 1 to 2 clicks finer, maintain a slower, more controlled pour rate (aiming for a 3 to 3.5 minute total brew time for a 250g brew), or raise water temperature to 205°F (96°C) for light roasts. According to Scott Rao’s “The Coffee Brewer’s Companion” (2014), the single most common cause of under-extraction in pour over is a grind that is too coarse combined with a pour rate that is too fast, reducing contact time below what the grind size requires for full extraction.
A Hario V60 pour over dripper combined with a refractometer and a scale gives you complete control over every extraction variable, making consistent 20% to 21% extraction yield achievable within a few sessions of systematic adjustment.
Cold Brew: Measuring Concentrate TDS Before Dilution
Cold brew concentrate sits at 3% to 5% TDS before dilution, which is above the direct measurement range of optical refractometers (0 to 10 Brix). Digital refractometers with a 0 to 25 Brix range (the Atago PAL-COFFEE and DiFluid R2 Extract both cover this range) measure undiluted cold brew concentrate directly without needing additional dilution.
A standard cold brew recipe uses a 1:8 ratio (100g coffee, 800g cold water), steeping for 12 to 24 hours at 35 to 40°F (2 to 4°C). The target TDS for concentrate before 1:1 dilution is 3.5% to 4.5%. After dilution, the final beverage should read 1.5% to 2.5% TDS, which is higher than hot filter coffee TDS because cold brew is typically served over ice and further diluted during consumption.
Steeping time is the primary extraction lever for cold brew. Extending steep time from 12 hours to 24 hours at constant temperature increases extraction yield by approximately 2% to 4%, depending on grind size. Grind size is the secondary lever. Coarser grinds (extra coarse, 1000 to 1400 microns) require longer steep times to reach target extraction yield. Medium-coarse grinds (700 to 900 microns) reach target extraction faster but increase the risk of over-extraction and bitterness at the 24-hour mark.
A large capacity cold brew coffee maker with a fine mesh filter works best when you know your target concentrate TDS from the refractometer, allowing you to stop steeping precisely when you hit 4.0% TDS regardless of elapsed time.
AeroPress: Optimizing for Concentrate and Standard Strength
AeroPress extraction yield varies more than any other brew method because the recipe space is wider: brew times range from 60 seconds to 3 minutes, ratios range from 1:6 (concentrate) to 1:16 (standard strength), and water temperatures range from 165°F to 212°F (74°C to 100°C). The refractometer gives you a fixed reference point regardless of which recipe you use.
For a standard AeroPress recipe targeting 1:12 (15g coffee, 180g water, 195°F / 90°C, 90 second steep), the target TDS is 1.3% to 1.5% and extraction yield is 18% to 22%. For the World AeroPress Championship-style recipes, which often use a 1:6 ratio and subsequent water dilution, measure the concentrate TDS before dilution and calculate extraction yield based on the coffee dose and beverage weight after dilution.
The Science of Coffee TDS Measurement: What the Refractometer Actually Detects
A coffee refractometer does not directly detect the hundreds of individual compounds dissolved in coffee. It measures the collective refractive index of the solution, which correlates to the total mass of dissolved solids as a percentage of the liquid weight. The refractive index increases linearly with dissolved solid concentration across the TDS range relevant to coffee, which is why the simple multiplication formula produces reliable extraction yield calculations.
The specific compounds the refractometer aggregates include sucrose and reducing sugars (which contribute sweetness and body), chlorogenic acids and their degradation products (which contribute acidity and some bitterness), Maillard reaction products and melanoidins (which contribute body, color, and roasty notes), caffeine (which contributes bitterness at high concentrations), and volatile aromatic compounds in small but perceptible quantities.
This matters because the refractometer cannot distinguish between a solution where TDS is high because sugars extracted well, versus a solution where TDS is high because bitter compounds over-extracted. Both show the same TDS reading at the same extraction yield. This is why sensory evaluation (tasting the cup) remains essential alongside refractometer data. The refractometer tells you how much extracted. Your palate tells you what extracted and whether the balance is correct.
The coffee-specific refractive index correction (multiplying raw Brix by approximately 0.85) is necessary because the standard Brix scale is calibrated to sucrose solutions, and coffee has a different relationship between dissolved solid concentration and refractive index than pure sucrose. VST Inc. published this correction factor based on calibration work comparing refractometer Brix readings against gravimetrically determined TDS across hundreds of coffee samples. The Atago PAL-COFFEE and DiFluid R2 Extract apply this correction automatically in their coffee measurement modes.
Water quality has a direct and measurable effect on refractometer readings. According to the SCA Water Quality Handbook, water with total dissolved minerals above 150 ppm contributes to a higher baseline refractive index, which shifts all TDS readings slightly high if the refractometer is zeroed with the brewing water rather than distilled water. Always zero with distilled or reverse osmosis water to eliminate the mineral baseline. This is the most common source of systematic error in home refractometer use, producing readings that consistently overestimate extraction yield by 0.3% to 0.8%.
Understanding what the refractometer measures, and what it cannot measure, is what separates useful data collection from number-chasing that does not connect to cup quality.
Coffee Refractometer vs TDS Meter: Which Measures Extraction Better?
A TDS meter (also called an electrical conductivity meter or EC meter) measures the electrical conductivity of a solution as a proxy for dissolved solid concentration. A coffee refractometer measures the optical refractive index of the solution directly. Both produce a TDS estimate, but they work on fundamentally different physical principles and produce different levels of accuracy for coffee.
TDS meters calibrated for tap water and general water quality work (the most common type, including the common $15 pen-style meters) measure the conductivity of ionic compounds in solution. Coffee TDS is dominated by non-ionic compounds including sugars, organic acids, and melanoidins, which conduct electricity poorly. This means TDS meters significantly underestimate coffee concentration, typically reading 30% to 50% lower than the true TDS measured by refractometer. A filter coffee with a true 1.3% TDS by refractometer might read 0.6% to 0.8% on a non-specialized TDS meter.
Use the table below to compare the two measurement approaches across the specifications that matter for coffee dialing-in decisions.
| Feature | Coffee Refractometer | TDS Meter (Conductivity) |
|---|---|---|
| Measurement principle | Optical refractive index | Electrical conductivity |
| Accuracy for coffee TDS | High (0.01-0.001% TDS) | Low (30-50% underestimate) |
| Espresso measurement | Yes (with dilution) | Not reliable |
| Filter coffee measurement | Yes (direct) | Usable if calibrated for coffee |
| Water quality measurement | Not suitable | Accurate (designed for this) |
| Extraction yield calculation | Yes (via formula or app) | Not reliable without correction |
| Price range | $30-$330 | $10-$50 |
| Best use for coffee | Extraction yield and cup strength | Brewing water mineral content |
The practical recommendation is to use both instruments for different purposes. A TDS meter for water quality testing ($10 to $20) measures brewing water mineral content in parts per million (ppm), which the SCA recommends keeping at 75 to 150 ppm for optimal espresso and filter extraction. A coffee refractometer measures extraction yield from the brewed beverage. The two instruments answer different questions and are not interchangeable for coffee work.
You can read more about how water mineral content interacts with extraction chemistry in our dedicated guide on understanding coffee TDS and how water quality affects your brew.
Common Refractometer Mistakes and How to Fix Them
Most inaccurate refractometer readings trace back to one of five recurring mistakes. Identifying and eliminating these mistakes before interpreting your extraction yield data is what separates useful measurement practice from misleading number generation.
Measuring Hot Samples
Hot coffee measured directly after brewing reads lower TDS than the same coffee cooled to room temperature because thermal expansion dilutes the dissolved solid concentration per unit volume. A sample at 80°C (176°F) can read 0.2% to 0.4% lower TDS than the same sample at 20°C (68°F). Automatic temperature compensation (ATC) in digital refractometers corrects for temperature variation between approximately 10°C and 40°C (50°F to 104°F), but ATC does not fully compensate for samples above 50°C (122°F). Cool samples to below 30°C (86°F) before measuring, regardless of whether your refractometer has ATC.
Zeroing with Tap Water
Tap water in most regions contains 50 to 300 ppm dissolved minerals. Zeroing with tap water incorporates those minerals into the zero reference, causing all subsequent coffee readings to be artificially low by 0.05% to 0.15% TDS depending on local water hardness. Always zero with distilled water, reverse osmosis water, or deionized water. Keep a small bottle of distilled water next to the refractometer and replace it every two to three weeks to avoid bacterial contamination that shifts the refractive index.
Not Diluting Espresso Samples
Undiluted espresso at 8% to 12% TDS exceeds the linear measurement range of most refractometers. The sensor reads a value, but the relationship between refractive index and TDS becomes non-linear above approximately 6% Brix equivalent. The result is a reading that appears plausible but under-reports the true TDS by 10% to 20%. Always dilute espresso at a 1:3 ratio with distilled water and multiply the reading by 4. The Atago PAL-COFFEE and VST LAB III have sufficient range to measure undiluted espresso accurately, but dilution adds a margin of safety and reduces sensor contamination from concentrated coffee oils.
Using Coffee-Contaminated Distilled Water to Zero
If the zeroing water bottle is stored uncapped near the espresso machine, coffee vapors, steam, and micro-droplets contaminate the water over time. A contaminated zero reference shifts all readings high, consistently overestimating extraction yield. Replace zeroing water regularly and store it capped away from brewing surfaces.
Sampling Before the Brew Is Mixed
For batch-brewed filter coffee and French press, the concentration at the top of the vessel differs from the concentration at the bottom because denser dissolved compounds sink as the coffee cools. Stirring or swirling the beverage before sampling produces a representative reading. Sampling directly from the stream during pour over gives a mid-brew reading, not a final beverage reading. Always sample from the complete mixed beverage.
Eliminating these five error sources makes refractometer data reliable enough to guide systematic dialing-in decisions across every brew session, which is the entire point of the instrument.
Refractometer Maintenance, Calibration, and Longevity
A digital coffee refractometer maintained correctly lasts 5 to 10 years of daily use. The sensor prism and LED light source are the two components most affected by improper care. Coffee oils are the primary contamination risk, and physical impact is the primary damage risk for optical prism surfaces.
Clean the sensor after every measurement session. Wipe the sensor surface with a damp lint-free cloth (microfiber is ideal), then dry completely with a second dry cloth. Do not use abrasive materials, paper towels, or cotton balls, which leave micro-scratches on polished prism surfaces over time. For stubborn coffee oil residue, wipe with a cloth dampened with isopropyl alcohol (70%), then follow with a distilled water wipe to remove alcohol residue before the next measurement.
Calibrate the zero point at the start of every measurement session, not just once per day. Ambient temperature changes between sessions shift the zero point by enough to affect reading accuracy. A refractometer zeroed at 18°C (64°F) in the morning reads differently at 26°C (79°F) in the afternoon, even with ATC, because ATC corrects for sample temperature, not for zero-point drift caused by ambient temperature changes in the instrument itself.
Check calibration accuracy quarterly by measuring a known-concentration sucrose solution. A 10% sucrose solution (10g sucrose dissolved in 90g distilled water) should read 10.0% Brix on a properly calibrated refractometer with a well-functioning prism. A reading outside 9.8% to 10.2% Brix indicates prism contamination, alignment drift, or sensor degradation requiring professional service or factory recalibration.
Store the refractometer in its case, away from direct sunlight. UV exposure degrades the sensor lens coating on some digital models over time. For optical refractometers, store with the eyepiece cap in place to prevent dust accumulation on the internal prism surfaces.
The microfiber cleaning cloths and protective case accessories for pocket refractometers are inexpensive ($5 to $15) and extend sensor life significantly compared to wiping with tissue or paper.
Building a Consistent Coffee Measurement Workflow
A refractometer is most valuable when it is part of a repeatable measurement workflow rather than an occasional diagnostic tool. The difference between using a refractometer productively and using it frustratingly is a system that captures consistent data across sessions, allowing you to identify genuine trends in your extraction rather than chasing noise from inconsistent sample preparation.
The minimum equipment for a productive home refractometer workflow is a digital coffee refractometer (Atago PAL-COFFEE or DiFluid R2 Extract for most home baristas), a 0.1g resolution scale, a supply of distilled water for zeroing, small sample cups for cooling espresso samples, and a simple log (paper or spreadsheet) recording dose, yield, grind setting, TDS, extraction yield, and a 1 to 5 taste rating for each session.
Log at minimum: the grind setting (by number or position), dose weight, yield weight (for espresso) or total beverage weight (for filter), TDS reading, calculated extraction yield, and a short flavor note (balanced, sour, bitter, thin, strong). After 10 to 15 logged sessions with the same bean, clear patterns emerge: which grind setting produces target extraction yield, how much extraction yield shifts with dose changes, and how fresh versus rested beans (degassed 5 to 14 days post-roast) affect TDS at the same grind setting.
Fresh roasted beans (roasted 1 to 4 days ago) produce variable TDS readings because CO2 off-gassing interrupts water-coffee contact during extraction, effectively under-extracting the brew regardless of grind size. Beans rested 7 to 14 days post-roast produce more consistent TDS readings because degassing is largely complete and extraction proceeds without CO2 interruption. This is one of the clearest patterns visible in logged refractometer data that taste alone cannot reliably detect.
A coffee scale with 0.1g resolution and built-in timer is the companion tool that makes refractometer data meaningful. Without precise dose and yield weights, extraction yield calculations contain errors large enough to render the refractometer data unactionable.
Once your workflow is established, the refractometer becomes a calibration tool you use when opening a new bag of beans or when something tastes off, not a tool you use every single shot. Most home baristas find that 10 to 15 refractometer-guided sessions with a new bean establishes the target recipe, which they then reproduce by recipe alone until the next bag. Understanding the full science of extraction alongside tools like the refractometer connects directly to how every variable in the coffee brewing process combines to produce the cup in your hands.
The best refractometer workflows are the ones you actually maintain consistently, which means keeping the instrument accessible, keeping distilled water stocked, and logging data in a format that takes under 30 seconds to record per session.
Which Grinder Do You Need for Refractometer-Based Dialing-In?
Refractometer data is only as repeatable as the grinder producing the coffee grounds. A grinder with high grind retention (the amount of coffee left inside the grinder between doses) produces inconsistent dose weights between shots, making TDS readings vary independently of your recipe changes. A grinder with wide particle size distribution produces TDS variance that looks like recipe instability when it is actually grinder instability.
For espresso refractometer work, the minimum grinder specification is a burr grinder with 40mm or larger flat or conical burrs, stepped or stepless grind adjustment capable of espresso-range settings (200 to 400 microns), and grind retention below 0.5g. The Baratza Encore ESP ($195 to $215) meets these specifications at the entry level for home espresso.
Key Specifications (Baratza Encore ESP): Burr size: 40mm conical steel. Grind settings: 40 stepped positions. RPM: 450. Grind range: espresso through coarse filter. Retention: approximately 0.5g to 1g. Price: $195 to $215.
For serious home espresso dialing-in, flat burr grinders in the $300 to $600 range produce tighter particle distributions and lower retention, which translates directly to more consistent TDS readings between shots. The Fellow Ode Gen 2 ($295 to $345) uses 64mm flat steel burrs and produces a bimodal particle distribution particularly well-suited to espresso extraction consistency.
Key Specifications (Fellow Ode Gen 2): Burr size: 64mm flat steel. Grind settings: 31 stepped positions. RPM: 600. Single-dose capable: yes (0g retention). Grind range: espresso through coarse filter. Price: $295 to $345.
For pour over and filter coffee refractometer work, any burr grinder with 40mm or larger burrs at a medium grind setting produces consistent enough particle distribution for repeatable TDS measurements. Grind retention matters less for filter work because dose variation of 0.5g has a proportionally smaller effect on extraction yield at the 15g to 20g dose range used in filter brewing compared to the effect at the 18g to 19g range used in espresso.
The investment in a quality burr grinder is the prerequisite for productive refractometer use. Without consistent grind, the refractometer data cannot be reliably attributed to recipe variables because an uncontrolled grinder variable runs beneath every reading. Our comparison of espresso machines matched with the right grinder for home dialing-in covers how these two tools work together to produce consistent shots.
Frequently Asked Questions About Coffee Refractometers
Can I use a regular Brix refractometer for coffee instead of a coffee-specific one?
A standard Brix refractometer works for coffee with a manual correction factor of 0.85 applied to the Brix reading to approximate TDS percentage. For example, a 1.5% Brix reading multiplied by 0.85 gives approximately 1.275% TDS for filter coffee. The limitation is resolution: most optical Brix refractometers have a 0.2% Brix resolution, which translates to a TDS resolution of approximately 0.17%, too coarse for precise espresso extraction yield calculation where 0.1% TDS differences matter.
For filter coffee work where 0.17% TDS resolution is acceptable, a standard 0 to 10 Brix optical refractometer at $30 to $60 produces usable results. For espresso work, a dedicated coffee refractometer with built-in coffee refractive index correction and 0.01% or finer TDS resolution is the correct choice.
What is the difference between extraction yield and TDS in coffee?
TDS (total dissolved solids) measures the concentration of dissolved coffee compounds in the brewed liquid, expressed as a percentage of the beverage weight. Extraction yield measures what percentage of the original dry coffee dose dissolved into the water. A 1.3% TDS filter coffee brewed from 15g of coffee into 250g of water has an extraction yield of 1.3% multiplied by 250, divided by 15, equal to 21.7%.
TDS alone tells you how strong the coffee tastes. Extraction yield tells you how efficiently the coffee dissolved. Two brews can share the same TDS but have different extraction yields (different brew ratios), and two brews can share the same extraction yield but different TDS (same extraction efficiency, different strength). Both numbers together define where a brew sits on the SCA Brewing Control Chart.
Why does my refractometer give different readings from the same shot?
Shot-to-shot variation in refractometer readings above 0.05% TDS indicates one of three things: inconsistent sample temperature between readings, sensor contamination from previous measurements that were not cleaned properly, or genuine shot-to-shot extraction inconsistency caused by the grinder, dose variation, or channeling. To isolate the cause, take three readings from the same cooled and mixed sample. If the three readings from the same sample vary by more than 0.03% TDS, the issue is the instrument (contamination or calibration). If readings from the same sample are consistent but vary between shots, the issue is extraction inconsistency.
The most common cause in home espresso settings is incomplete sensor cleaning between measurements, particularly coffee oil residue left on the sensor surface that shifts subsequent readings. Clean with a damp lint-free cloth and re-zero with distilled water between every measurement session.
Do I need to dilute filter coffee before measuring with a refractometer?
No. Filter coffee TDS ranges from 1.0% to 1.6%, which is well within the direct measurement range of all coffee refractometers, including basic optical models with a 0 to 10 Brix range. Filter coffee samples do not require dilution before measurement. Only espresso, which reaches 8% to 12% TDS, requires dilution to stay within the linear measurement range of most refractometers and to protect the sensor from concentrated coffee oil exposure.
Can a refractometer measure whether my coffee beans are fresh?
A refractometer cannot directly assess bean freshness, but it indirectly reveals staleness through consistently low extraction yield readings at correct grind settings. Stale beans (typically over 6 to 8 weeks post-roast for whole beans, or over 2 to 3 weeks post-grind for pre-ground) produce lower TDS than fresh beans at identical recipe parameters because aged beans have lost volatile aromatic compounds and soluble precursors during oxidation. If your extraction yield reads 1% to 2% lower than your historical baseline for the same recipe with no grind or recipe changes, the beans have likely gone past their peak extraction window.
Fresh beans roasted 7 to 14 days prior produce the most consistent and highest extraction yield readings, according to research in Scott Rao’s “The Professional Barista’s Handbook.” Beans within 2 to 4 days of roast date produce variable readings due to active CO2 off-gassing interrupting extraction.
What TDS should cold brew concentrate read on a refractometer?
Cold brew concentrate brewed at a 1:8 ratio (100g coffee in 800g cold water, steeped 12 to 18 hours) should read 3.5% to 4.5% TDS before dilution. This requires a digital refractometer with a range above 10% Brix (the Atago PAL-COFFEE, DiFluid R2 Extract, and VST LAB III all cover this range). After a standard 1:1 dilution with water or milk, the final beverage reads 1.75% to 2.25% TDS, which is higher than hot filter coffee but appropriate for the lower perceived intensity of cold-temperature beverages.
If the concentrate reads below 3% TDS after the standard steep time, extend steeping by 4 hours and re-measure. If it reads above 5% TDS, the grind was too fine or the ratio too concentrated for the intended dilution factor. Dilute at 1:2 (concentrate to water) rather than 1:1 to bring the final beverage into the preferred drinking-strength range.
Is the VST refractometer worth the price over the Atago PAL-COFFEE for home use?
For most home baristas, the VST LAB III at $300 to $330 provides ten times the resolution of the Atago PAL-COFFEE (0.001% vs 0.01% TDS) but the practical difference in dialing-in outcomes at home is minimal. A 0.01% TDS resolution from the Atago translates to approximately 0.17% extraction yield resolution at a 1:15 brew ratio, which is sufficient for all practical home espresso and filter coffee adjustments. The VST’s advantage becomes meaningful for competition calibration (where 0.1% extraction yield differences affect scoring), cafe recipe standardization across multiple grinders, and research-level coffee work.
The DiFluid R2 Extract at $70 to $90 provides 0.003% TDS resolution, sits between the Atago and VST in both price and precision, and is the best value for home baristas who want near-professional accuracy without the professional price. Most home baristas who upgrade from Atago to VST after a year of daily use report that the data quality improvement is real but not practically consequential for home workflow decisions.
Why does my espresso taste different even when the refractometer shows the same TDS?
Identical TDS readings with different flavor profiles indicate that the same quantity of material dissolved, but the composition of what dissolved was different. This occurs when grind size, temperature, pressure profile, or pre-infusion time changes between shots. A coarser grind with longer shot time extracts more sugars and fewer harsh compounds at the same TDS as a finer grind with shorter shot time that extracts more early-stage acids. Both can produce 10% TDS in the cup with very different flavor characteristics.
The refractometer measures total dissolved solids quantity. It cannot distinguish between a sweet, well-balanced extraction and a sour, acid-forward extraction at the same concentration. Sensory evaluation paired with refractometer data gives you the complete picture: the refractometer confirms you hit your yield target, and your palate confirms the extraction was balanced. Use both, never just one.
Can I use a refractometer to improve my drip coffee machine results?
A refractometer is directly applicable to drip coffee machine optimization. Most home drip machines brew between 195°F and 205°F (90°C to 96°C), and most reach their target temperature only in the first half of the brew cycle, dropping as low as 180°F (82°C) toward the end. This temperature drop produces under-extraction in the second half of the brew, pulling extraction yield below 18% even with correct dose and grind. A TDS reading showing 1.0% to 1.1% from a 1:15 brew ratio confirms this diagnosis: extraction yield calculates to approximately 15% to 16%, well below the SCA ideal range.
The fix for drip machine under-extraction is grind slightly finer and use a pre-wet or bloom cycle if the machine has one. SCAA-certified drip machines (the Breville Precision Brewer, Technivorm Moccamaster, and Bonavita 8-Cup are certified examples) maintain temperature throughout the brew cycle and consistently produce extraction yields in the 18% to 22% range. If your machine does not reach target TDS with standard settings, the machine, not the recipe, is the limiting factor. Choosing a better brewer is covered in our guide to selecting a drip machine that actually reaches SCA brewing temperature.
Does roast level affect what TDS reading I should target?
Roast level affects extraction rate but not the SCA’s ideal TDS target range. Light roasts are denser, harder, and extract more slowly than dark roasts at the same grind size and water temperature. A light roast brewed at 200°F (93°C) might produce 1.1% TDS where a dark roast brewed identically produces 1.4% TDS, even though both are within the 1.15% to 1.35% SCA ideal range. The fix for a light roast reading below target TDS is to raise water temperature to 205°F to 208°F (96°C to 98°C) and grind slightly finer.
Dark roasts extract faster because roasting degrades the cellular structure of the bean and increases solubility. A dark roast brewed at 205°F (96°C) with a medium-fine grind often over-extracts into bitterness before hitting target TDS, producing high extraction yield (above 22%) with TDS within range. For dark roasts, lower water temperature to 195°F (90°C) and coarsen the grind relative to a medium roast at the same brew ratio. The refractometer will show when you have found the right balance for the specific roast level in your cup.
What is the SCA Brewing Control Chart and how does it relate to refractometer readings?
The SCA Brewing Control Chart is a two-axis graph developed by the Specialty Coffee Association mapping TDS (coffee strength, on the vertical axis) against extraction yield percentage (on the horizontal axis) to define four brewing outcome zones: ideal (balanced, sweet, clear), strong (over-concentrated), weak (under-concentrated), and under-extracted or over-extracted (flavor imbalance regardless of strength). The chart originated from research by Dr. E.E. Lockhart at the Coffee Brewing Institute in the 1950s and was refined by the SCA into the current standard used in the Q Grader certification curriculum.
A refractometer reading plots one point on this chart per brew. A brew with 1.3% TDS and 20% extraction yield plots in the center of the ideal zone. A brew with 0.9% TDS and 15% extraction yield plots in the under-extracted and weak zone. The chart makes the diagnostic process visual: plot the point, see which zone it falls in, and adjust the recipe toward the center of the ideal zone in the direction the chart indicates. The SCA Golden Cup Standard for filter coffee defines the ideal zone as 1.15% to 1.35% TDS and 18% to 22% extraction yield, a target the refractometer makes achievable in any home setup.
Can I measure TDS from a coffee capsule or pod machine with a refractometer?
A refractometer measures the brewed liquid from any source, including Nespresso, Keurig K-Cup, or other capsule systems. Nespresso Original Line capsules typically produce brewed espresso-style liquid at 6% to 9% TDS, below the 8% to 12% TDS of a well-pulled espresso because capsule systems operate at lower pressure (5 to 7 bar versus 9 bar for espresso) and use pre-ground coffee with limited freshness. Dilute the capsule output at 1:3 with distilled water before measuring, apply the x4 multiplication, and calculate extraction yield from the dose weight printed on the capsule packaging.
The refractometer data from capsule systems is useful for comparing capsule output to freshly pulled espresso and for understanding why capsule coffee has a different body and clarity despite appearing similar in volume. The lower TDS and extraction yield of most capsule systems explains the thinner, less complex flavor profile compared to freshly ground and pulled espresso at the same ratio.
Conclusion
A coffee refractometer gives you the extraction yield data to stop guessing and start systematically producing better espresso, pour over, and filter coffee every session. The Atago PAL-COFFEE and DiFluid R2 Extract cover the full range of home barista needs, with the DiFluid offering near-professional 0.003% TDS resolution at $70 to $90.
The three numbers to keep in mind are simple: 18% to 22% extraction yield, 1.15% to 1.35% TDS for filter coffee, and 9% to 11% TDS for espresso. Everything else in refractometer-guided dialing-in is a systematic process of measuring, adjusting one variable, and measuring again until those three numbers line up with what is in the cup.
Start with the DiFluid R2 Extract or the Atago PAL-COFFEE, keep distilled water stocked for zeroing, log your readings, and within 10 to 15 sessions you will have a data-backed recipe for every bean you brew. For the full context on how refractometer data connects to sourcing, roast level, and brew method selection, our complete guide to brewing better coffee from bean selection through extraction covers every variable in the chain.